STORMSENSE AI FORECAST
Platform Capabilities Live Radar How It Works District Monitoring Impact About
Independent Hackathon Project • Not an official government warning service

Forecasting Severe-Weather Risk 2–6 Hours Ahead Across West Bengal.

An AI nowcasting model fusing NOAA GFS live atmospheric analyses, trained on four monsoon seasons of ECMWF ERA5 reanalysis, with physics-guided deep learning — estimating thunderstorm, heavy-rain and flash-flood risk across all 23 districts of West Bengal from the Darjeeling Himalayas to the Sundarbans.

Live NOAA GFS Ingestion, Refreshed Every 5 Minutes • Calibrated Probabilities, Reported Openly
LOADING CASE STUDY
…
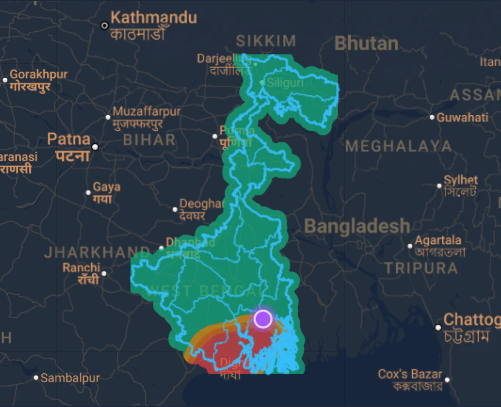
StormSense risk map screenshot from the Cyclone Remal historical case study, showing colour-banded severe-weather risk bands across West Bengal districts
MODEL: SEVEREWEATHERNET V2
GRID: 825 CELLS · 0.25°
LOADING…
LOADING
PEAK 3H RAINFALL —  
Highest District Risk: —
SEVERITY INDEX: — StormSense V2 · Calibrated
FORECAST WINDOW
2–6 Hours
Model lead times from each GFS analysis
LIVE SKILL
~1.8×
PR-AUC vs. no-skill baseline, live GFS input
SPATIAL GRID
~28 km
0.25° grid, 825 cells across 23 districts
REFRESH
5 min
Checks for new GFS cycles (published every 6h)
// MEASURED, NOT CLAIMED

Capabilities: What the Model Actually Does

Two different operating conditions, because they give very different numbers. Lab is held-out ERA5 (the model's own training distribution); live is real NOAA GFS input, which is what the dashboard actually runs on.

HELD-OUT ERA5 TEST (2024 SEASON)

Lab Conditions

Performance on the same reanalysis distribution the model was trained on. This is the best case, not what the live dashboard sees — the live input comes from a different weather system (GFS).

Forecast Leads: +2h to +6h
Spatial Grid: 0.25° (~28 km), 825 cells
CSI (+2h → +6h): 0.394 → 0.244
False Alarm Ratio (FAR): 0.52 – 0.64
LIVE GFS BACKTEST (2024, 14 CASES)

Operational Reality

What the deployed dashboard actually achieves, fed real live NOAA GFS 0.25° analyses. Lower than the lab figures because GFS and ERA5 are genuinely different atmospheric systems.

Forecast Leads: +2h to +6h
Skill vs. No-Skill Baseline: ~1.8× (PR-AUC)
CSI (+2h → +6h): 0.049 → 0.081
False Alarm Ratio (FAR): 0.86 – 0.92
Thunderstorm probability per cell
3-hour rainfall regression
Terrain-aware flash-flood proxy
Per-lead calibrated probabilities
RADAR & SATELLITE FEEDS

Live Radar & Satellite View

A public precipitation radar mosaic (RainViewer), live over the West Bengal domain.

LOADING RADAR
REGIONAL COMPOSITE | SOURCE: RAINVIEWER | COVERAGE: WB + NEIGHBOURS
STORMSENSE MODEL RISK
Normal Watch Alert Warning
DATA SOURCES
RainViewer Radar Mosaic
LOADING
NOAA GFS 0.25° Analysis
Every 6h
Esri Dark Gray Basemap
Static Tiles
WHAT THIS VIEW SHOWS
Layer Product Update Kind
Radar mosaic RainViewer composite ~10 min OBSERVED
Model risk (dashboard) StormSense severe-weather % 5 min FORECAST
GFS analysis (input) NOAA GFS 0.25° f000 6h OBSERVED
The radar mosaic above is observed precipitation (RainViewer), a different product from the model's own forecast risk surface shown on the dashboard. Open the dashboard for the combined view.
MODEL PIPELINE

How It Works: From Public Weather Data to District Risk

Four stages, from a public global weather analysis to a calibrated, per-district risk estimate.

Refreshes every 5 minutes
01 // Ingest

NOAA GFS Analyses

Surface and pressure-level fields fetched from NOAA's public GFS archive, regridded to the model's domain, and linearly interpolated between the two most recent 6-hourly analyses into six hourly input slots. No forecast hour is ever used as an input.

0.25° Domain, 20–28°N 84–90°E
02 // Harmonise

Match the Training Domain

The model trained on ERA5 but runs live on GFS. Units, sign conventions (e.g. convective inhibition) and precipitation-accumulation windows are aligned so live input means what the training input meant.

ERA5 ↔ GFS Domain Adaptation
03 // Predict

ConvGRU Nowcaster

Separate recurrent encoders read surface, wind and thermodynamic fields; a terrain-conditioned fusion trunk combines them; a shared decoder outputs severe-weather probability and 3-hour rainfall for every lead.

781,889 Parameters
04 // Calibrate & Explain

Physics-Rule Attribution

Probabilities are temperature-calibrated per lead, then combined with a terrain-aware flash-flood proxy. A rule-based physics breakdown (moisture, instability, wind, recent rain) explains each estimate — not a learned attribution method.

Per-Lead Temperature Scaling
INPUT NOAA GFS 0.25° f000 Analyses
COVERAGE 825 Cells, 23 Districts
TRAINING ERA5, May–Oct 2021–2024
STATIC INPUT SRTM Terrain Elevation
// DISTRICT ADVISORIES

District Monitoring: Per-District Risk, Ranked

The dashboard aggregates the 825-cell risk grid into 19 district zones, using the highest-risk cell in each district, and ranks them so the most concerning district always leads.

LOADING LIVE DATA
Loading current district risk…
// IN-APP ALERTING

Impact: What the Alert System Actually Reaches

StormSense can push a real alert to everyone currently viewing the dashboard. It is not connected to any government siren network, SMS gateway, or disaster-response service — the scope below is the honest, current reach.

In-App Siren Broadcast

A full-screen alert with sound and a browser notification, sent to every connected viewer inside the model's current high-risk zone. Location is checked on each viewer's own device and never sent to the server.

Reach: Connected Viewers Only

Advisory Bulletin Log

Informational advisories posted to a standing, readable log — no interruption, no sound. A visitor who opens the dashboard later can still read what was posted.

Persistence: Readable After The Fact

Operational Action Log

An operator can log a request for extended dissemination (e.g. cell broadcast). This does not reach any phone — it is an auditable record for handoff to a real disaster-management authority.

Delivery status: Logged, Not Sent
Honest Scope

No Physical Sirens, No SMS, No Government Integration Today

Reaching people beyond this website — physical sirens, cell broadcast, SMS to the public — requires infrastructure and legal authority owned by government disaster-management bodies and telecom operators. StormSense can supply a risk feed to such a system; it cannot operate one itself.

Reach today: In-App Only
Try the Live Alert System
// ABOUT

About StormSense

An independent hackathon project exploring whether a compact deep-learning model can give useful early signal of severe convective weather over West Bengal from freely available global weather data. Not affiliated with, endorsed by, or operated on behalf of IMD, WBSDMA, NDMA, MoES, or any government body.

Why the Model's Estimate Can Be Checked

Physics-based rule attribution for the current highest-risk cell — not a learned method (no SHAP, no LIME).

LOADING LIVE DATA
Loading current attribution…
Physics-Based, Not a Black Box Every attribution above traces to a real atmospheric field the model consumes — nothing is inferred after the fact.
RULE-BASED ATTRIBUTION
OPEN SOURCE · SELF-HOSTABLE

Want to try it, extend it, or build on it?

The full source, model checkpoints, and every backtest script used to produce the numbers on this page are on GitHub. Run it yourself, verify the results, or fork it for another region.

PyTorch FastAPI ECMWF ERA5 NOAA GFS